
FIGURE 22-88
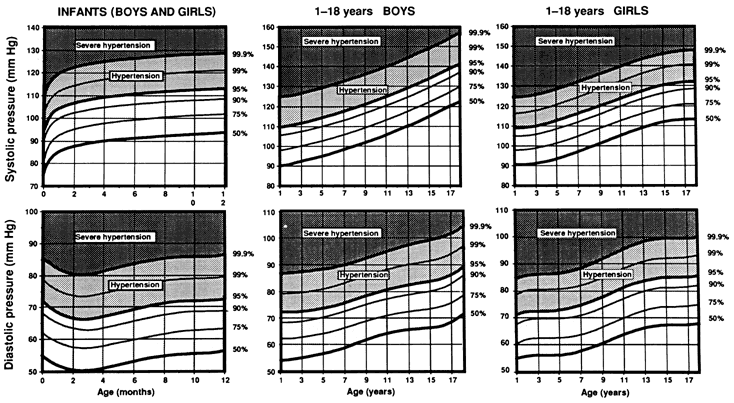
Figure 22-88. Normal values for systolic and diastolic (fourth phase) blood pressures adapted from the data provided by the Task Force. There are some minor differences less than 5 mm Hg between some of the values depicted in this figure and in the figures produced by the Task Force. These differences are less than those observed in different sets of normal values. Severe hypertension, based on clinical experience, and described by the Task Force, is approximately at the 99.9th percentile.