Figure 37-2
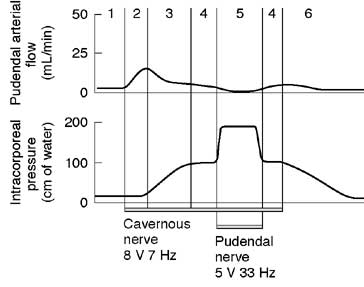
Figure 37-2. Phases of penile erection (induced in monkeys via neurostimulation). Numbers correspond to phases outlined in Table 37-1. (Lower tracing = intracavernous pressure; upper tracing = flow within the internal pudendal artery.)
 Health.am
Figure 37-2. Phases of penile erection (induced in monkeys via neurostimulation). Numbers correspond to phases outlined in Table 37-1. (Lower tracing = intracavernous pressure; upper tracing = flow within the internal pudendal artery.)