Figure 90-8
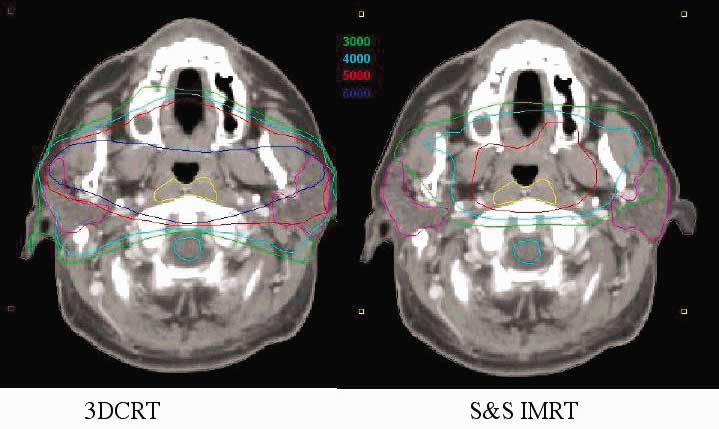
FIGURE 90-8 A comparison between the isodose distributions produced by optimized, three-dimensional conformal radiotherapy and by IMRT.
 Health.am
FIGURE 90-8 A comparison between the isodose distributions produced by optimized, three-dimensional conformal radiotherapy and by IMRT.